

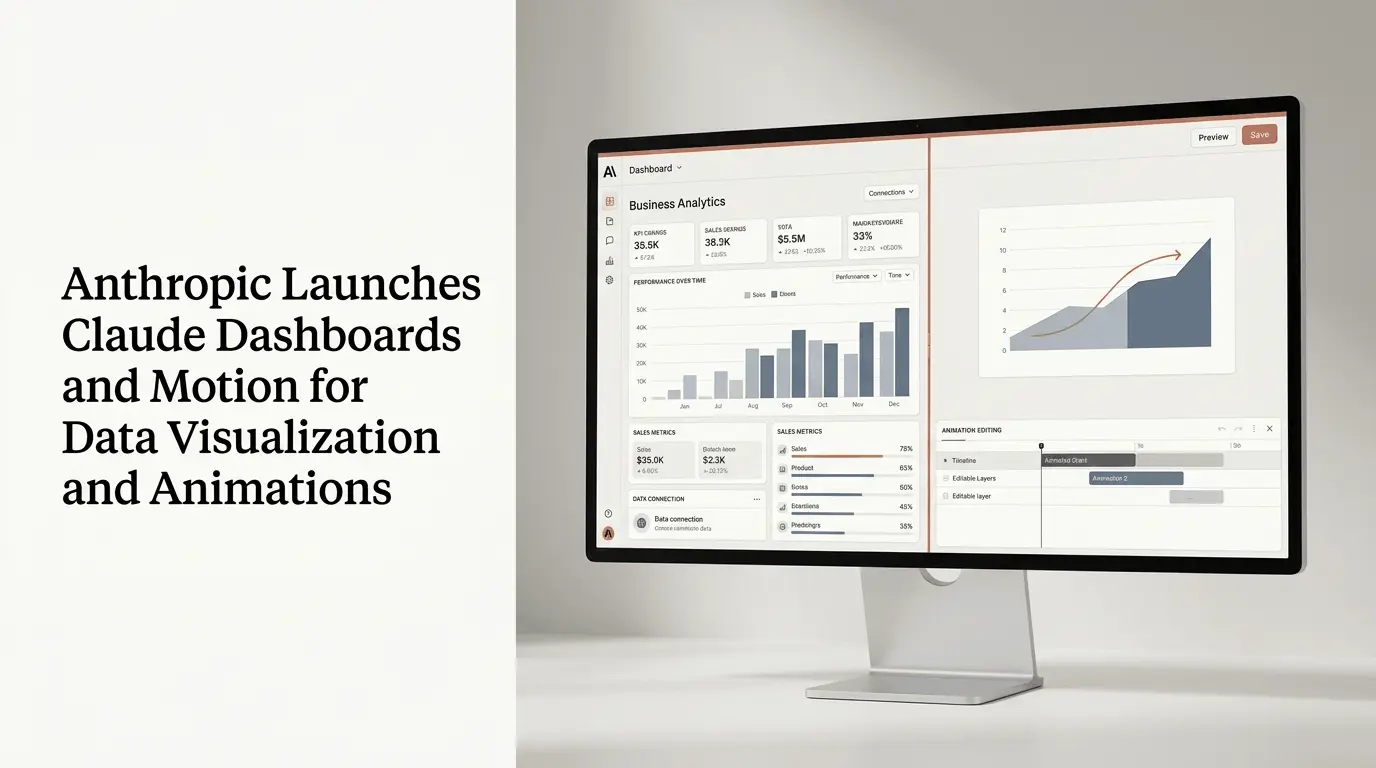
Anthropic introduced Claude Dashboards and Claude Motion on October 8, 2026, adding tools that let users turn business data into interactive dashboards and transform reports, charts, and product walkthroughs into editable animations. Both features are available in beta, with access determined by subscription plan.
The launch expands Claude’s workplace capabilities beyond conversational AI and document creation. Dashboards connects to supported data platforms and customer relationship management (CRM) tools to generate visual reports from natural-language questions, while Motion creates animations using editable code rather than AI-generated video footage.
Anthropic also removed the beta label from Claude Docs, Slides, and Design, making these creation tools available across all plans, including Free, subject to applicable organization settings.
Quick Summary
- Anthropic introduced Claude Dashboards and Claude Motion in beta on October 8, 2026.
- Claude Dashboards turns natural-language questions about connected business data into dashboards, charts, and metrics.
- Claude Motion creates editable, code-based animations from reports, charts, and other content, with MP4 export.
- Dashboards is available on Pro, Max, Team, and Enterprise plans; Motion is available on Team and Enterprise.
- Claude Docs, Slides, and Design became available across all plans, including Free.
- The update brings data analysis, visualization, animation, and collaborative content creation into Claude’s broader workflow.
What Is Claude Dashboards?
Claude Dashboards is a data visualization feature that allows users to query connected business data in plain language and generate dashboards without manually building every chart or writing each query themselves.
According to Anthropic, the feature supports connections to data platforms including Amazon Redshift, Google BigQuery, ClickHouse, Databricks, and Snowflake. It can also work with connected applications, including Salesforce, to visualize information such as sales opportunities.
For example, a sales manager could ask Claude to compare this month’s opportunities with the previous month or visualize revenue by region. Claude can use the connected data to create a dashboard containing relevant metrics and charts.
a) How Claude Dashboards works?
The feature is designed to make exploratory analysis more accessible while keeping the underlying data operations visible.
- Natural-language queries: Users ask questions about business data without having to formulate every database query manually.
- Automatically generated dashboards: Claude turns the request into visualizations and metrics relevant to the question.
- Query transparency: Users can inspect the query behind a chart or metric and ask Claude to explain it.
- Data freshness: Charts display when their data was last refreshed, helping users understand how current the information is.
- Analytics integrations: Dashboards can be sent to supported analytics tools for more detailed investigation.
Anthropic lists Amplitude, Grafana, Hex, Mixpanel, Omni, Perplexity, PostHog, and Sigma among the tools supported for continuing analysis, with Looker, monday.com, and Tableau described as forthcoming integrations in the announcement.
This positions Claude Dashboards as a complementary tool for quick questions and initial exploration, rather than a replacement for every business intelligence (BI) platform. More complex analysis can continue in dedicated analytics software.
Claude Motion Turns Reports and Charts Into Editable Animations
Claude Motion is a new feature for creating short animated explainers from text prompts, reports, charts, images, and product walkthroughs. It is intended for users who need to communicate information visually without producing an entire video from scratch.
A user could, for example, ask Claude to animate a chart for a board presentation, turn a quarterly report into a short company update, or create a product walkthrough for customer onboarding. Claude generates an animation that users can refine through the editor or by requesting further changes.
a) How Claude Motion differs from AI video generation
One important distinction is how the animations are produced. Anthropic says Claude Motion writes code to animate text, charts, shapes, and images instead of relying on a video-generation model.
This approach gives users direct control over individual elements, including wording, numbers, and timing. Finished animations can be exported as MP4 files.
The feature is therefore focused on explainers and presentation graphics rather than generating realistic video footage or synthetic people.
Anthropic also lists Adobe, Descript, HeyGen, Higgsfield, InVideo, Luma AI, and Runway as tools users can open animations in for additional editing. Canva and Captions are identified as forthcoming integrations in the announcement.
For businesses, the practical advantage is the ability to convert existing information into visual communication material while retaining control over important details. However, because the feature is in beta, its suitability for production workflows will depend on how well it performs for individual use cases.
Claude Dashboards vs. Claude Motion: Key Differences
Although both tools are part of Claude’s expanding creation capabilities, they address different tasks.
| Feature | Claude Dashboards | Claude Motion |
|---|---|---|
| Primary purpose | Explore and visualize business data | Create animated explainers |
| Input | Connected data sources and natural-language questions | Prompts, reports, charts, text, and images |
| Output | Dashboards, metrics, and charts | Editable animations |
| Transparency and editing | Inspect chart queries and refresh information | Edit animation code-driven elements, text, and timing |
| Export or integration | Send dashboards to supported analytics tools | Export as MP4 and continue editing in supported tools |
| Beta availability | Paid plans | Team and Enterprise |
These differences are based on Anthropic’s October 8 announcement and its published feature descriptions.
Claude Docs, Slides, and Design Leave Beta
Alongside the two new beta features, Anthropic made Claude Docs, Slides, and Design generally available across its plans, including Free.
These tools let users create and refine documents, presentations, and visual designs within Claude. Users and Claude can work on the same materials, with options for direct editing and supported exports.
Anthropic also announced several improvements to its broader Artifacts experience:
- Team collaboration: Teams can work with Claude on the same document, presentation, design, or dashboard.
- External sharing: Slides, designs, dashboards, and animations can be shared outside an organization or with anyone holding a link when administrator settings permit it.
- Document exports: Presentations can be downloaded as PowerPoint or PDF files, and decks can be transferred to Google Slides as editable files.
- Mobile editing: Users can edit documents, presentations, and designs through Claude’s mobile app.
- Enterprise controls: Artifacts now support customer-managed encryption keys (CMEK), alongside administrative controls for selecting available templates.
Anthropic said users had created more than 45 million documents, decks, and designs in Claude since the tools were introduced. That figure is a company-reported usage metric, not an independently verified measure of active users or productivity gains.
a) What happens to the standalone Claude Design website?
Claude Design has also been integrated into regular Claude conversations, where it can use conversational context, files, and connectors.
Anthropic plans to close the standalone Claude Design website at claude.ai/design on December 14, 2026. Existing projects will remain accessible there until that date, and users can migrate their design systems to the Artifacts experience.
Anthropic advises users to save relevant chats and comments because these will not be available after the standalone site close.
Claude Dashboards and Motion: Availability and Access
The two beta features have different eligibility requirements. Users should check their plan and, for organizational accounts, whether an administrator has enabled the relevant templates.
| Feature | Availability |
|---|---|
| Claude Dashboards | Pro, Max, Team, and Enterprise |
| Claude Motion | Team and Enterprise |
| Claude Docs | All plans, including Free |
| Claude Slides | All plans, including Free |
| Claude Design | All plans, including Free |
Anthropic’s Help Center confirms these plan restrictions. On Enterprise accounts, Dashboards and Motion are disabled by default until an administrator enables them. Docs, Slides, and Design are scheduled to turn on by default for Enterprise on October 15, 2026, except in HIPAA-enabled organizations.
The company has not announced a separate price for Dashboards or Motion in the cited announcement. Their availability is tied to eligible Claude subscriptions, so users should consult the official Claude pricing page for current plan details.
Why Anthropic’s Latest Claude Update Matters?
The October update brings data exploration, animation, document creation, presentations, and visual design into a more unified workflow.
For analysts, Claude Dashboards could reduce the time needed to investigate routine business questions and produce initial visualizations. Its ability to expose the queries behind charts also gives users a way to inspect how results were generated, although query visibility alone does not guarantee that the underlying data or interpretation is correct.
Claude Motion addresses a different problem: turning information that already exists into a more accessible visual explanation. Because the animations are code-based and editable, users can adjust details without regenerating an entire video from scratch.
The broader direction is to make Claude useful not only for generating text and answering questions, but also for creating work products that people can inspect, edit, share, and take into other applications. The new features remain in beta, so their reliability and usefulness in specific business environments still need to be evaluated in practice.
FAQs
1. What is Claude Dashboards?
Claude Dashboards is a beta feature that connects Claude to supported data platforms and business applications, allowing users to ask questions in natural language and generate dashboards with charts and metrics.
2. What is Claude Motion?
Claude Motion is a beta tool that creates editable animations from prompts, reports, charts, and other content. It uses code-based animation rather than a video-generation model and supports MP4 export.
3. Can free Claude users access Dashboards and Motion?
No. Dashboards is available on Pro, Max, Team, and Enterprise plans. Motion is available on Team and Enterprise plans. Docs, Slides, and Design are available across all plans, including Free.
4. Can users edit animations created with Claude Motion?
Yes. Users can edit animations in the editor or ask Claude to make changes. The code-based approach allows adjustments to text, numbers, shapes, and timing, and finished animations can be exported as MP4 files.
Also Read –
Claude Haiku 5.5 Launches With 75% Lower Cost
Claude Sonnet 5.5 Delivers 30% Faster AI Performance